Every market update you read about Nashville is built on the same number: homes are selling in about 15 to 20 days. That number is true. It is also measured only on the homes that sold.
I wanted to know what happened to the rest. So I pulled every Davidson County listing from the MLS for the 12 months ending 2026-08-04. That is 33,774 listings across 26 zip codes, deduplicated and sorted by how each one actually ended.
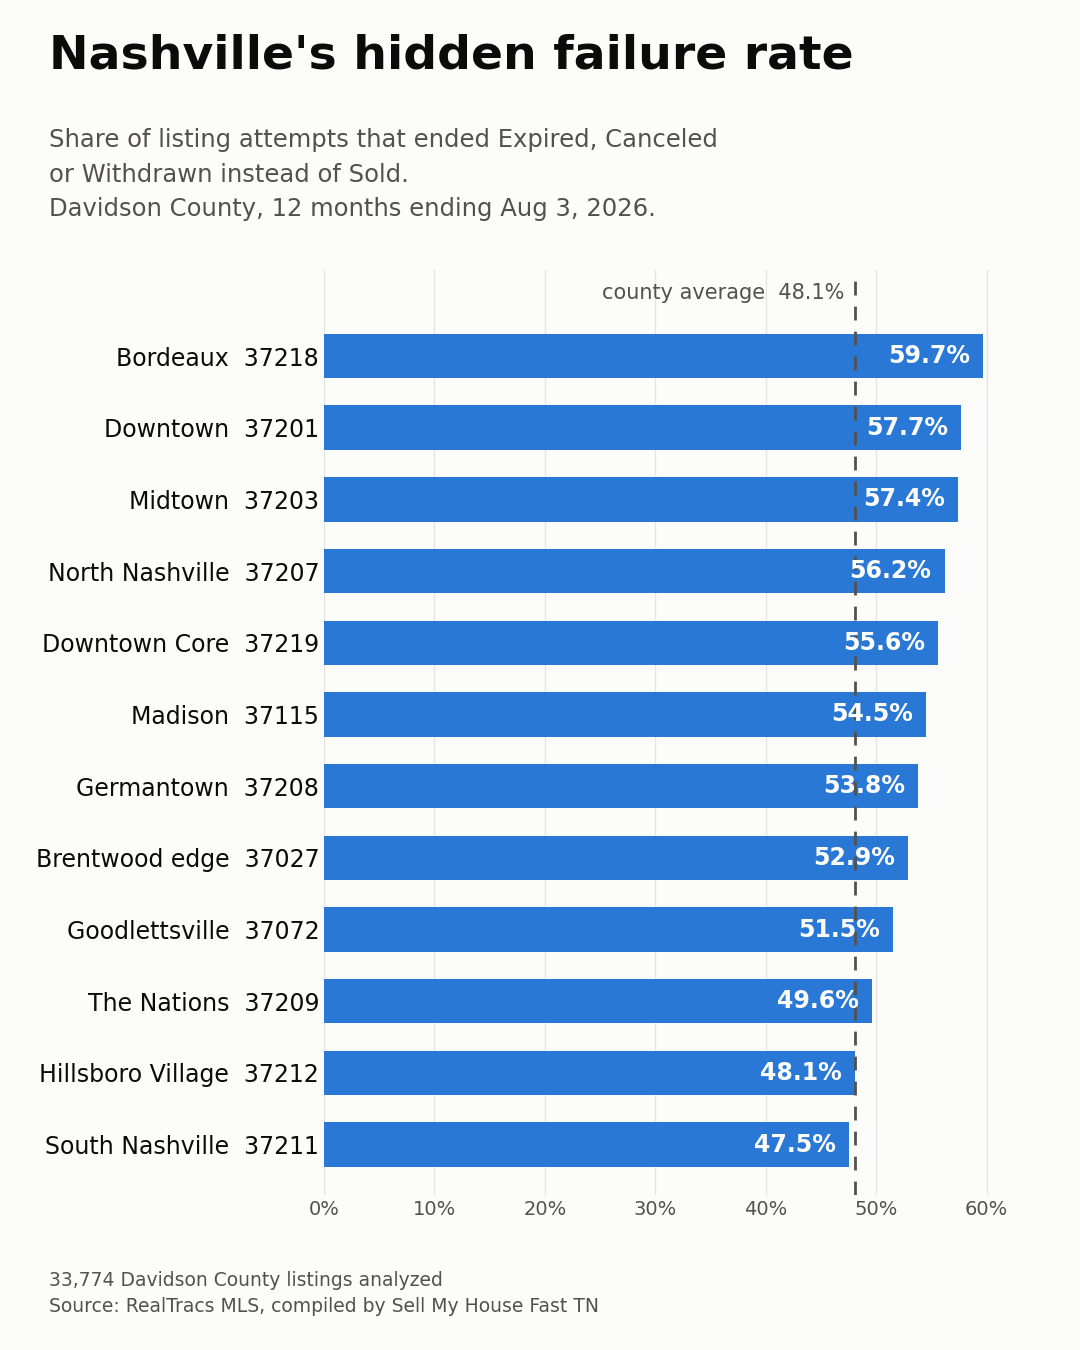
Here is what I found: 48.1% of them never sold. They expired, they were cancelled, or the seller withdrew them.
Almost half.
Where listings fail most
The county average is 48.1%, but it is not spread evenly.
| Neighborhood | Zip | Listings that ended without a sale |
|---|---|---|
| Bordeaux | 37218 | 59.7% |
| Downtown | 37201 | 57.7% |
| Midtown / Music Row | 37203 | 57.4% |
| North Nashville | 37207 | 56.2% |
| Downtown Core | 37219 | 55.6% |
| Madison | 37115 | 54.5% |
| Germantown / Hope Gardens | 37208 | 53.8% |
| Brentwood edge | 37027 | 52.9% |
| Goodlettsville | 37072 | 51.5% |
| Sylvan Park / The Nations | 37209 | 49.6% |
| Hillsboro Village / Vanderbilt | 37212 | 48.1% |
| Crieve Hall / South Nashville | 37211 | 47.5% |
And the other end of the table, where listings actually close: Whites Creek at 32.9%, Oak Hill at 34.5%, Donelson / Airport at 37.9%, Bellevue at 39.3%, Hermitage at 42.0%.
If your house is in 37218 or 37203, you are closer to a coin flip than a sale.
The number nobody reports
Here is the part that changed how I read every market report.
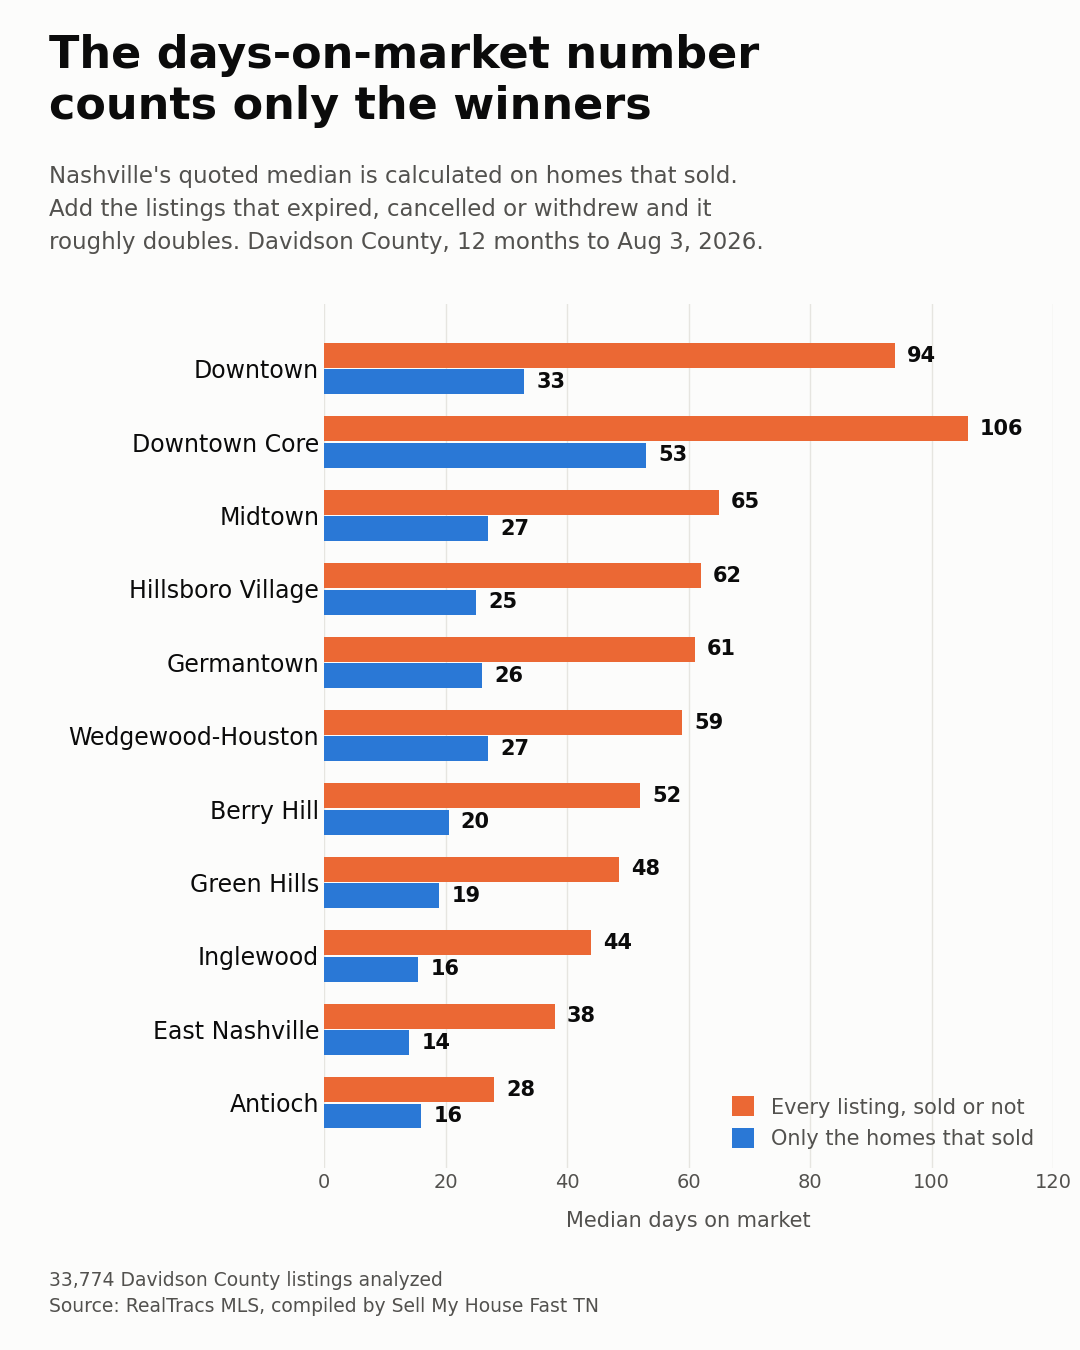
The median days-on-market figure everyone quotes is calculated only on homes that closed. It is a survivor’s number. When I recalculated across every listing, including the ones that gave up, it roughly doubled in every single zip code.
| Neighborhood | Sold homes only | Every listing |
|---|---|---|
| Downtown | 33 days | 94 days |
| Downtown Core | 53 days | 106 days |
| Midtown / Music Row | 27 days | 65 days |
| Hillsboro Village / Vanderbilt | 25 days | 62 days |
| Germantown / Hope Gardens | 26 days | 61 days |
| Berry Hill / Melrose | 20 days | 52 days |
| Green Hills / Forest Hills | 19 days | 48 days |
| East Nashville | 14 days | 38 days |
| Antioch | 16 days | 28 days |
So when someone tells a downtown condo owner that Nashville moves in under three weeks, the honest answer for their building is closer to 94 days.
What is actually driving it
Property type matters more than most sellers think. Single family homes closed at a median of 15 days. Townhouses took 25. Condos took 33, and condos also settled for the least relative to asking, at 96.2% of original list price versus 97.5% for single family.
The bottom of the market is the hardest place to sell, not the easiest. Homes under $200K closed at just 90.9% of original list price after a median 26 days on market.
Supply is wildly uneven. Brentwood edge has 1.8 months of supply. Downtown Core has 20.9. Same county, same month.
If you are the seller in that group
Nothing in this data says your house is unsellable. It says the listing path failed, which is a different problem.
The listings that fail tend to share the same shape. They were priced against a neighbor’s asking price instead of a neighbor’s closing price. They needed work the seller could not front. They were on a timeline the market did not agree to. Or the seller was solving for something other than price, like a job start date, a probate deadline, or a house they no longer live near.
If that is you, the first move is not another agent and another 90 days. It is finding out what your house is actually worth to a buyer who will close, and comparing that to what another listing cycle would net you after carrying costs, repairs and commission.
I buy houses in Davidson County directly, and I will tell you honestly when listing is the better math. If you want that comparison run on your specific address, call or text 615-436-8003.
If you build or flip here, I ran the same data by year built and produced a build-or-flip call for every Davidson zip code, including months of supply by vintage and the cost side. That is here: Build or Flip in Nashville? I Ran All 26 Davidson Zip Codes.
A note on the method, because it matters
“Never sold” means the listing ended as Expired, Cancelled or Withdrawn rather than Closed, as a share of all listings in that zip over the 12 months ending 2026-08-04.
One honest caveat: some of those sellers relisted later and eventually closed under a new MLS number, so this measures listing attempts that ended without a sale, not houses that are permanently unsellable.
Scope is Davidson County only, 33,774 listings, 11,546 of which closed. Source RealTracs MLS. I compiled and analyzed the data myself. Five Nashville zip codes straddle a county line and only their Davidson portions are counted here. If you want the zip-level numbers behind any of this, ask and I will send them.