I pulled all 36,994 Davidson County listings from the last 12 months and cut them by year built, which is a split the usual market reports never do. They stop at single family, townhouse and condo. That tells you nothing about whether to build or renovate on a given street.
First, the number that breaks the model
| Cohort | Listings | Failed | DOM (sold) | SP/OLP | Took a price cut | Months supply |
|---|---|---|---|---|---|---|
| New construction, 2023+ | 9,793 | 61.3% | 14 | 100.0% | 23.0% | 5.5 |
| Built 2000 to 2022 | 9,838 | 46.6% | 27 | 97.0% | 38.1% | 5.6 |
| Flip pool, pre-2000 | 13,506 | 41.1% | 17 | 96.7% | 34.6% | 3.6 |
New construction fails at 61.3% while closing at 100.0% of original list price, with only 23.0% of listings ever recording a price cut. That looks impossible until you see the mechanism.
Builders do not discount. They cancel the listing and relist at the number they want. A homeowner who misprices leaves a trail of reductions. A builder leaves a cancelled listing and a fresh MLS number. So a real share of that failure rate is listing churn rather than unsold houses, and it means two things if you underwrite here:
- Sale-to-list ratio is close to useless as a softness signal for new construction. It will read near 100% no matter how dead the submarket is.
- Judge new-build demand by months of supply instead. That number is not gameable by relisting.
Where renovating beats building
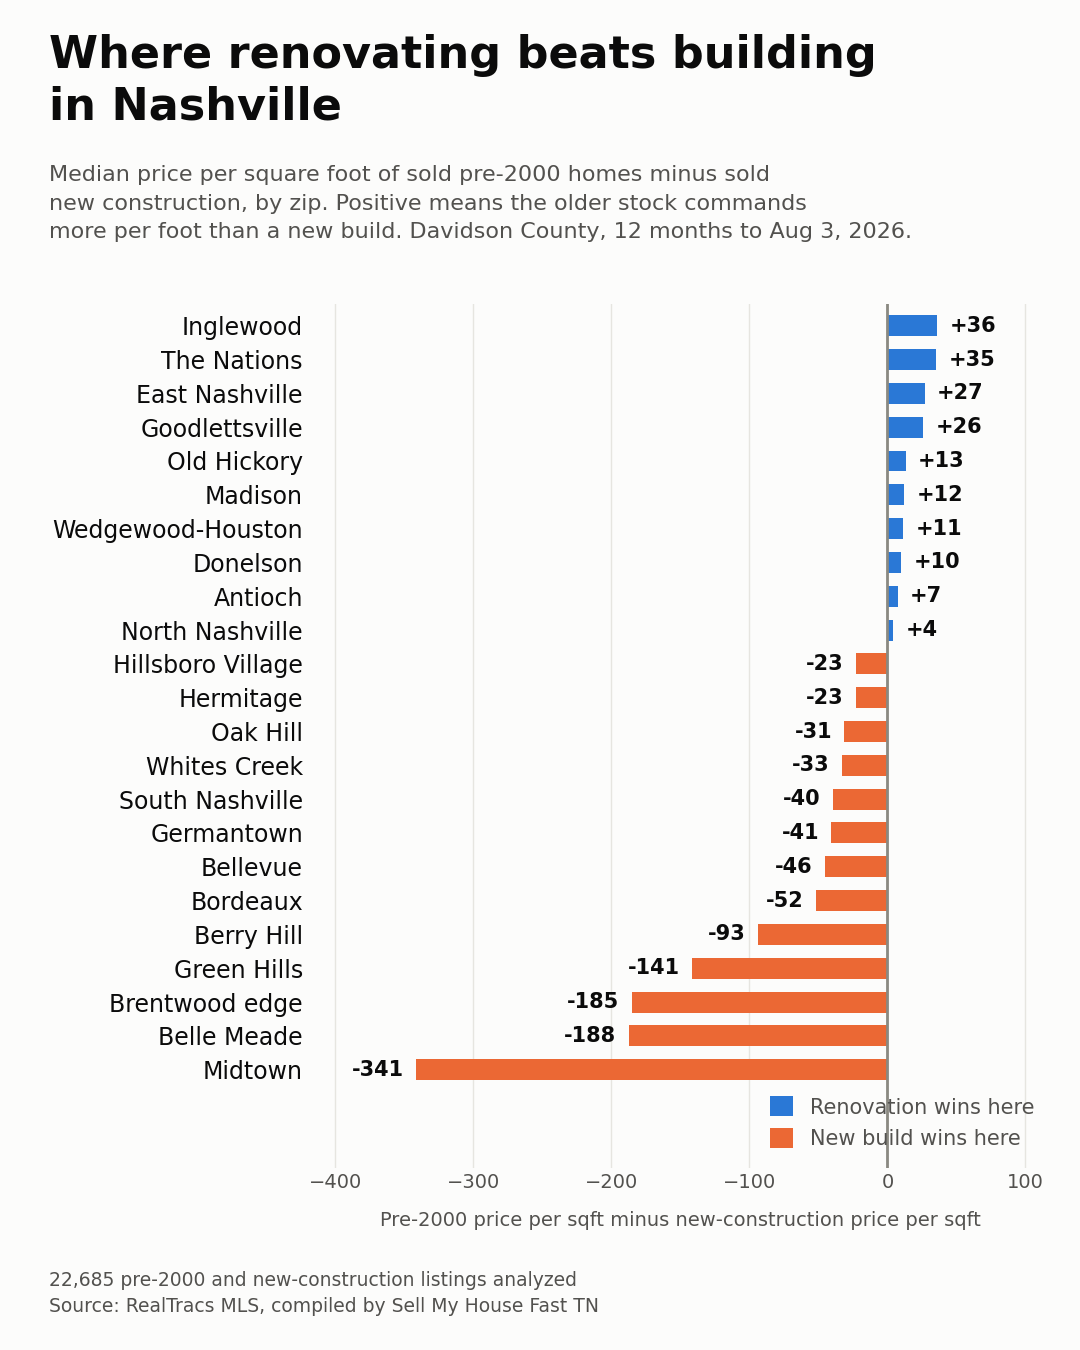
In 10 zip codes the older stock earns more per square foot than a new build does.
Flip markets
| Zip | Neighborhood | $/sqft spread | Resale supply | New-build supply | Resale failed | New-build failed |
|---|---|---|---|---|---|---|
| 37206 | East Nashville | +27 | 2.3 | 5.5 | 35.5% | 59.7% |
| 37207 | North Nashville | +4 | 3.3 | 6.4 | 45.8% | 64.8% |
| 37209 | Sylvan Park / The Nations | +35 | 3.1 | 6.4 | 41.1% | 61.7% |
| 37210 | South Nashville / Industrial | +11 | 4.8 | 7.0 | 39.2% | 47.0% |
| 37216 | Inglewood | +36 | 2.7 | 4.3 | 36.9% | 57.0% |
Build markets
Demand only. Whether these can be built at a profit is the next section, and it changes the answer in several zips.
| Zip | Neighborhood | $/sqft spread | Resale supply | New-build supply | Resale failed | New-build failed |
|---|---|---|---|---|---|---|
| 37027 | Brentwood edge | -185 | 1.3 | 3.1 | 43.8% | 71.3% |
| 37204 | Berry Hill / Melrose | -93 | 4.5 | 4.3 | 40.2% | 55.1% |
| 37205 | Belle Meade / West Meade | -188 | 4.4 | 6.3 | 39.3% | 59.4% |
| 37215 | Green Hills / Forest Hills | -141 | 4.7 | 6.1 | 39.7% | 54.0% |
Where I would be careful right now
| Zip | Neighborhood | $/sqft spread | Resale supply | New-build supply | Resale failed | New-build failed |
|---|---|---|---|---|---|---|
| 37203 | Midtown / Music Row | -341 | 9.0 | 21.8 | 48.3% | 62.0% |
| 37208 | Germantown / Hope Gardens | -41 | 6.1 | 10.6 | 50.4% | 61.1% |
| 37218 | Bordeaux | -52 | 5.6 | 10.1 | 50.6% | 69.6% |
| 37220 | Oak Hill | -31 | 3.7 | 12.0 | 31.9% | 40.4% |
Midtown / Music Row is carrying 21.8 months of unsold new-construction supply. That is not an opinion about the neighborhood, it is a count of finished product already sitting in front of whatever you deliver next.
Does it pencil? The cost side
Everything above is exit-side. None of it tells you whether the thing can be built for less than it sells for, which is the question that actually kills most hot-build-zip calls.
Each row takes that zip’s median new-construction sale and median square footage and builds it at the cost tier that product falls in: $160/sqft for low-end product, $210 to $255/sqft for high-end above $900K resale. Plus 15% soft costs, 7% selling costs, against a 20% target margin.
The column that matters is margin with free land. A zip that cannot clear 20% when the land is free cannot be rescued by a cheap lot. It is not a build market at any land basis.
| Neighborhood | Median new sale | Cost tier | Margin, free land | Max cost/sqft | Call |
|---|---|---|---|---|---|
| Midtown / Music Row | $800K | $160 | 61% | $370 | PENCILS |
| Belle Meade / West Meade | $3.30M | $210-$255 | 52% to 43% | $373 | PENCILS |
| Berry Hill / Melrose | $2.48M | $210-$255 | 47% to 37% | $331 | PENCILS |
| Brentwood edge | $2.73M | $210-$255 | 46% to 36% | $329 | PENCILS |
| Green Hills / Forest Hills | $2.48M | $210-$255 | 43% to 32% | $306 | PENCILS |
| Crieve Hall / South Nashville | $850K | $160 | 41% | $224 | PENCILS |
| Germantown / Hope Gardens | $678K | $160 | 35% | $200 | PENCILS |
| South Nashville / Industrial | $550K | $160 | 33% | $194 | PENCILS |
| Sylvan Park / The Nations | $754K | $160 | 33% | $194 | PENCILS |
| Inglewood | $668K | $160 | 33% | $193 | PENCILS |
| Hillsboro Village / Vanderbilt | $1.05M | $210-$255 | 32% to 19% | $252 | COST SENSITIVE |
| East Nashville | $994K | $210-$255 | 26% to 12% | $230 | COST SENSITIVE |
| Oak Hill | $2.01M | $210-$255 | 25% to 10% | $226 | COST SENSITIVE |
| North Nashville | $512K | $160 | 23% | $167 | THIN |
| Bordeaux | $483K | $160 | 23% | $166 | THIN |
| Whites Creek | $582K | $160 | 20% | $160 | THIN |
| Old Hickory | $478K | $160 | 18% | $155 | NO MARGIN |
| Donelson / Airport | $555K | $160 | 17% | $155 | NO MARGIN |
| Hermitage | $470K | $160 | 9% | $140 | NO MARGIN |
| Antioch | $432K | $160 | 7% | $137 | NO MARGIN |
| Madison | $387K | $160 | 5% | $132 | NO MARGIN |
| Bellevue | $946K | $210-$255 | 5% to -14% | $173 | NO MARGIN |
| Goodlettsville | $317K | $160 | 2% | $128 | NO MARGIN |
7 of these zips cannot be built at a profit right now, even with free land: Old Hickory (18%), Donelson / Airport (17%), Hermitage (9%), Antioch (7%), Madison (5%), Bellevue (5%), Goodlettsville (2%).
That is the part worth sitting with. Antioch has one of the best new-construction absorption rates in the county at 1.8 months of supply. On demand data alone it looks like an obvious place to build. The median new house there sells for $432K at 2,007 square feet, which costs about $369K to build at builder grade. That is roughly $32K of profit with the land free. The lot is not free.
Cost sensitive: Hillsboro Village / Vanderbilt (clears at $210/sqft, fails at $255), East Nashville (clears at $210/sqft, fails at $255), Oak Hill (clears at $210/sqft, fails at $255). Your real cost decides these, not the market.
Max cost per square foot is the number to carry around. It is the hard cost that still leaves 20% with free land, so you can hold it against your own build number for whatever product that zip demands.
One caveat on the tier split: spec drives cost, and resale price is only a proxy for spec. A big plain house just over $900K builds nearer $160 than $255, so check the resale per foot before you trust a high-tier verdict on a low per-foot row.
How to use this
Three filters, in this order. Is there already a pile of unsold product in your exit band and vintage, measured in months of supply. Does the spread favor the vintage you are planning to deliver. And only then, does your land and construction budget clear the number the data says you will actually exit at.
The submarket failure rates matter as much as the price comps. I wrote up the county-wide version of that in the piece on why 48.1% of Nashville listings never sold, including why the days-on-market figure everyone quotes is calculated only on the homes that closed.
I run this analysis monthly across every Davidson zip code. If you build or flip here and want the full flipbook, call or text 615-436-8003.
Method
New construction means year built 2023 or later. The flip pool means built before 2000. Failure means the listing ended Expired, Cancelled or Withdrawn rather than Closed. Months of supply is active listings for that vintage divided by its 12-month sales rate. Zips with fewer than 25 listings on either side are omitted. Davidson County only, 36,994 listings, 11,546 closed, 12 months ending 2026-08-04, source RealTracs MLS. Five Nashville zips straddle a county line and only their Davidson portions are counted.
Because builders relist rather than reduce, some properties appear more than once under different MLS numbers. This measures listing attempts, not unique houses.